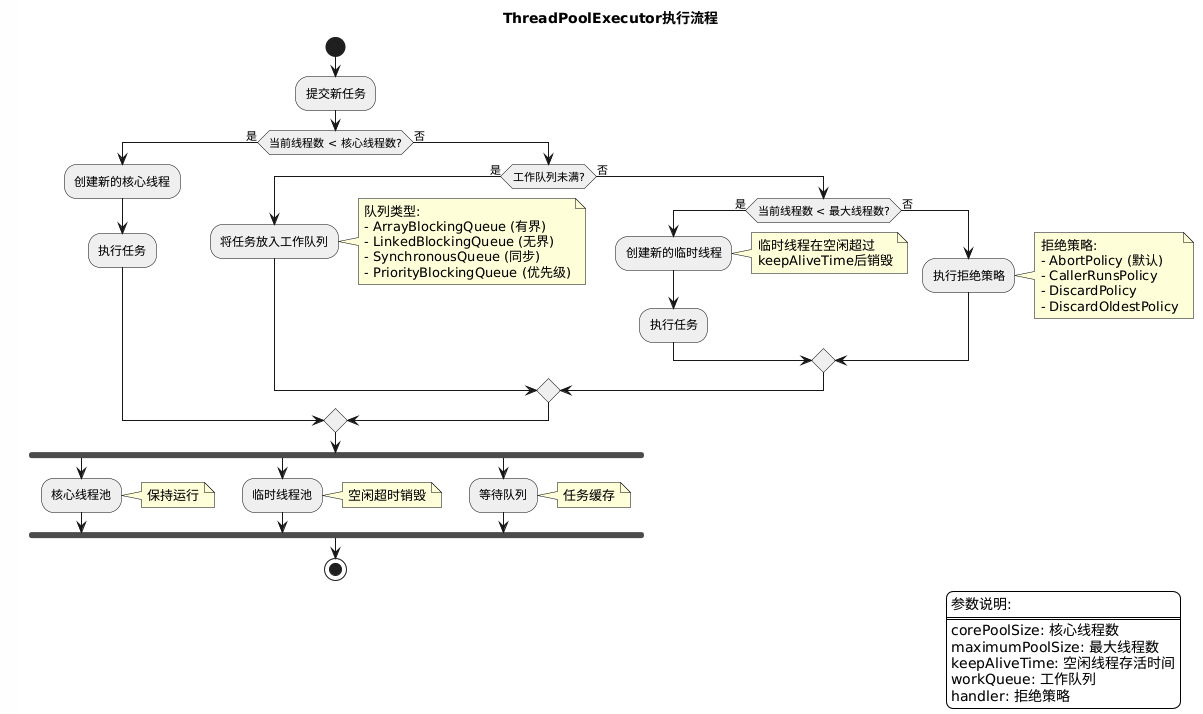
corePoolSize: the number of threads to keep in the pool, even if they are idle, unless allowCoreThreadTimeOut is set maximumPoolSize: the maximum number of threads to allow in the pool keepAliveTime when the number of threads is greater than the core, this is the maximum time that excess idle threads will wait for new tasks before terminating. unit : the time unit for the keepAliveTime argument workQueue: the queue to use for holding tasks before they are executed. This queue will hold only the Runnable tasks submitted by the execute method. handler: the handler to use when execution is blocked because the thread bounds and queue capacities are reache
[+] Running 0/0
 ⠋ Network mongo_default  Creating                                                                                                                       0.1s
[+] Running 2/2d orphan containers ([mongo-mongo-express-1]) for this project. If you removed or renamed this service in your compose file, you can run this c ✔ Network mongo_default  Created                                                                                                                        0.1s
 ✔ Container mongo        Created                                                                                                                        0.1s
Attaching to mongo
mongo  |
mongo  | WARNING: MongoDB 5.0+ requires a CPU with AVX support, and your current system does not appear to have that!
mongo  |   see https://jira.mongodb.org/browse/SERVER-54407
mongo  |   see also https://www.mongodb.com/community/forums/t/mongodb-5-0-cpu-intel-g4650-compatibility/116610/2
mongo  |   see also https://github.com/docker-library/mongo/issues/485#issuecomment-891991814
mongo  |
mongo  | /usr/local/bin/docker-entrypoint.sh: line 416:    28 Illegal instruction     "${mongodHackedArgs[@]}" --fork
mongo exited with code 132
SELECT pid, datname, usename, application_name, client_addr, client_port, to_char (now (), 'YYYY-MM-DD HH24:MI:SS') as now, to_char (now () - xact_start, 'DD HH24:MI:SS MS') as xact_time, to_char (now () - query_start, 'DD HH24:MI:SS MS') as query_time, state, to_char (now () - state_change, 'DD HH24:MI:SS MS') as state_time, wait_event, wait_event_type, left (query, 40) FROM pg_stat_activity WHERE state !='idle' and pid != pg_backend_pid () ORDERBY query_time desc;
找到具有等待事件的进程,向持有初始锁的PID汇总
This query looks at at the pg_stat_activity and pg_locks view showing the pid, state, wait_event, and lock mode, as well as blocking pids. 这个查询查看了 pg_stat_activity 和 pg_locks 视图,显示了 pid、state、wait_event 和 lock mode,以及阻塞的 pid。
WITH sos AS ( SELECT array_cat(array_agg(pid), array_agg((pg_blocking_pids(pid))[array_length(pg_blocking_pids(pid),1)])) pids FROM pg_locks WHERENOT granted ) SELECT a.pid, a.usename, a.datname, a.state, a.wait_event_type ||': '|| a.wait_event AS wait_event, current_timestamp-a.state_change time_in_state, current_timestamp-a.xact_start time_in_xact, l.relation::regclass relname, l.locktype, l.mode, l.page, l.tuple, pg_blocking_pids(l.pid) blocking_pids, (pg_blocking_pids(l.pid))[array_length(pg_blocking_pids(l.pid),1)] last_session, coalesce((pg_blocking_pids(l.pid))[1]||'.'||coalesce(casewhen locktype='transactionid'then1else array_length(pg_blocking_pids(l.pid),1)+1end,0),a.pid||'.0') lock_depth, a.query FROM pg_stat_activity a JOIN sos s on (a.pid =any(s.pids)) LEFTOUTERJOIN pg_locks l on (a.pid = l.pid andnot l.granted) ORDERBY lock_depth;
Set a lock timeout
It can be a good idea to set a lock_timeout within a session so that it will cancel the transaction and relinquish any locks it was holding after a certain period of time. 在会话中设置一个锁定超时可能是个好主意,这样在一段时间后它会取消事务并释放任何它持有的锁。
1
ALTERSYSTEMSET lock_timeout ='10s';
Logging
设置log_min_duration_statement来记录慢查询。
1
ALTER database postgres SET log_min_duration_statement ='250ms';
控制记录哪些类型的语句
1
ALTER DATABASE postgres SET log_statement ='all';
等待锁时记录
1
ALTER DATABASE postgres SET log_lock_waits ='on';
PERFORMANCE
使用语句超时来控制运行超时的查询。
Setting a statement timeout prevents queries from running longer than the specified time. You can set a statement timeout on the database, user, or session level. We recommend you set a global timeout on Postgres and then override that one specific users or sessions that need a longer allowed time to run. 设置语句超时时间可以防止查询运行时间超过指定的时间。您可以在数据库、用户或会话级别上设置语句超时时间。我们建议您在Postgres上设置一个全局超时时间,然后针对需要更长运行时间的特定用户或会话进行覆盖设置。
1
ALTER DATABASE mydatabase SET statement_timeout ='60s';
SELECT relname AS relation, pg_size_pretty ( pg_total_relation_size (C .oid) ) AS total_size FROM pg_class C LEFTJOIN pg_namespace N ON (N.oid = C .relnamespace) WHERE nspname NOTIN ( 'pg_catalog', 'information_schema' ) AND C .relkind <>'i' AND nspname !~'^pg_toast' ORDERBY pg_total_relation_size (C .oid) DESC
检查未使用的索引。
Will return the unused indexes in descending order of size. Keep in mind you want to also check replicas before dropping indexes.
1 2 3 4 5 6 7 8 9 10 11 12
SELECT schemaname ||'.'|| relname AStable, indexrelname AS index, pg_size_pretty(pg_relation_size(i.indexrelid)) AS "index size", idx_scan as "index scans" FROM pg_stat_user_indexes ui JOIN pg_index i ON ui.indexrelid = i.indexrelid WHERENOT indisunique AND idx_scan <50 AND pg_relation_size(relid) >5*8192 ORDERBY pg_relation_size(i.indexrelid) /nullif(idx_scan, 0) DESCNULLS FIRST, pg_relation_size(i.indexrelid) DESC;
获取表格的近似计数
Will return the approximate count for a table based on PostgreSQL internal statistics. Useful for large tables where performing a SELECT count(*) is costly on performance.
1
2
3
SELECT reltuples::numericas count FROM pg_class WHERE relname='table_name';
Non-blocking 创建索引
Adding CONCURRENTLY during index creation, while not permitted in a transaction, will not hold a lock on the table while creating your index.